|
|
点击上方蓝字和“好玩的MATLAB”一起快乐玩耍吧!
: R7 N! L. p8 f
5 g4 M" K* S( x( L- N' ]- b
hmhy5lzmk1r64024880352.jpg
 9 j3 i1 i( U$ _% W
好玩的matlab
6 ?2 u+ U3 _% x. I! u' B带你解锁不一样的matlab新玩法
$ _2 ?& q2 r( d) B% b* Z
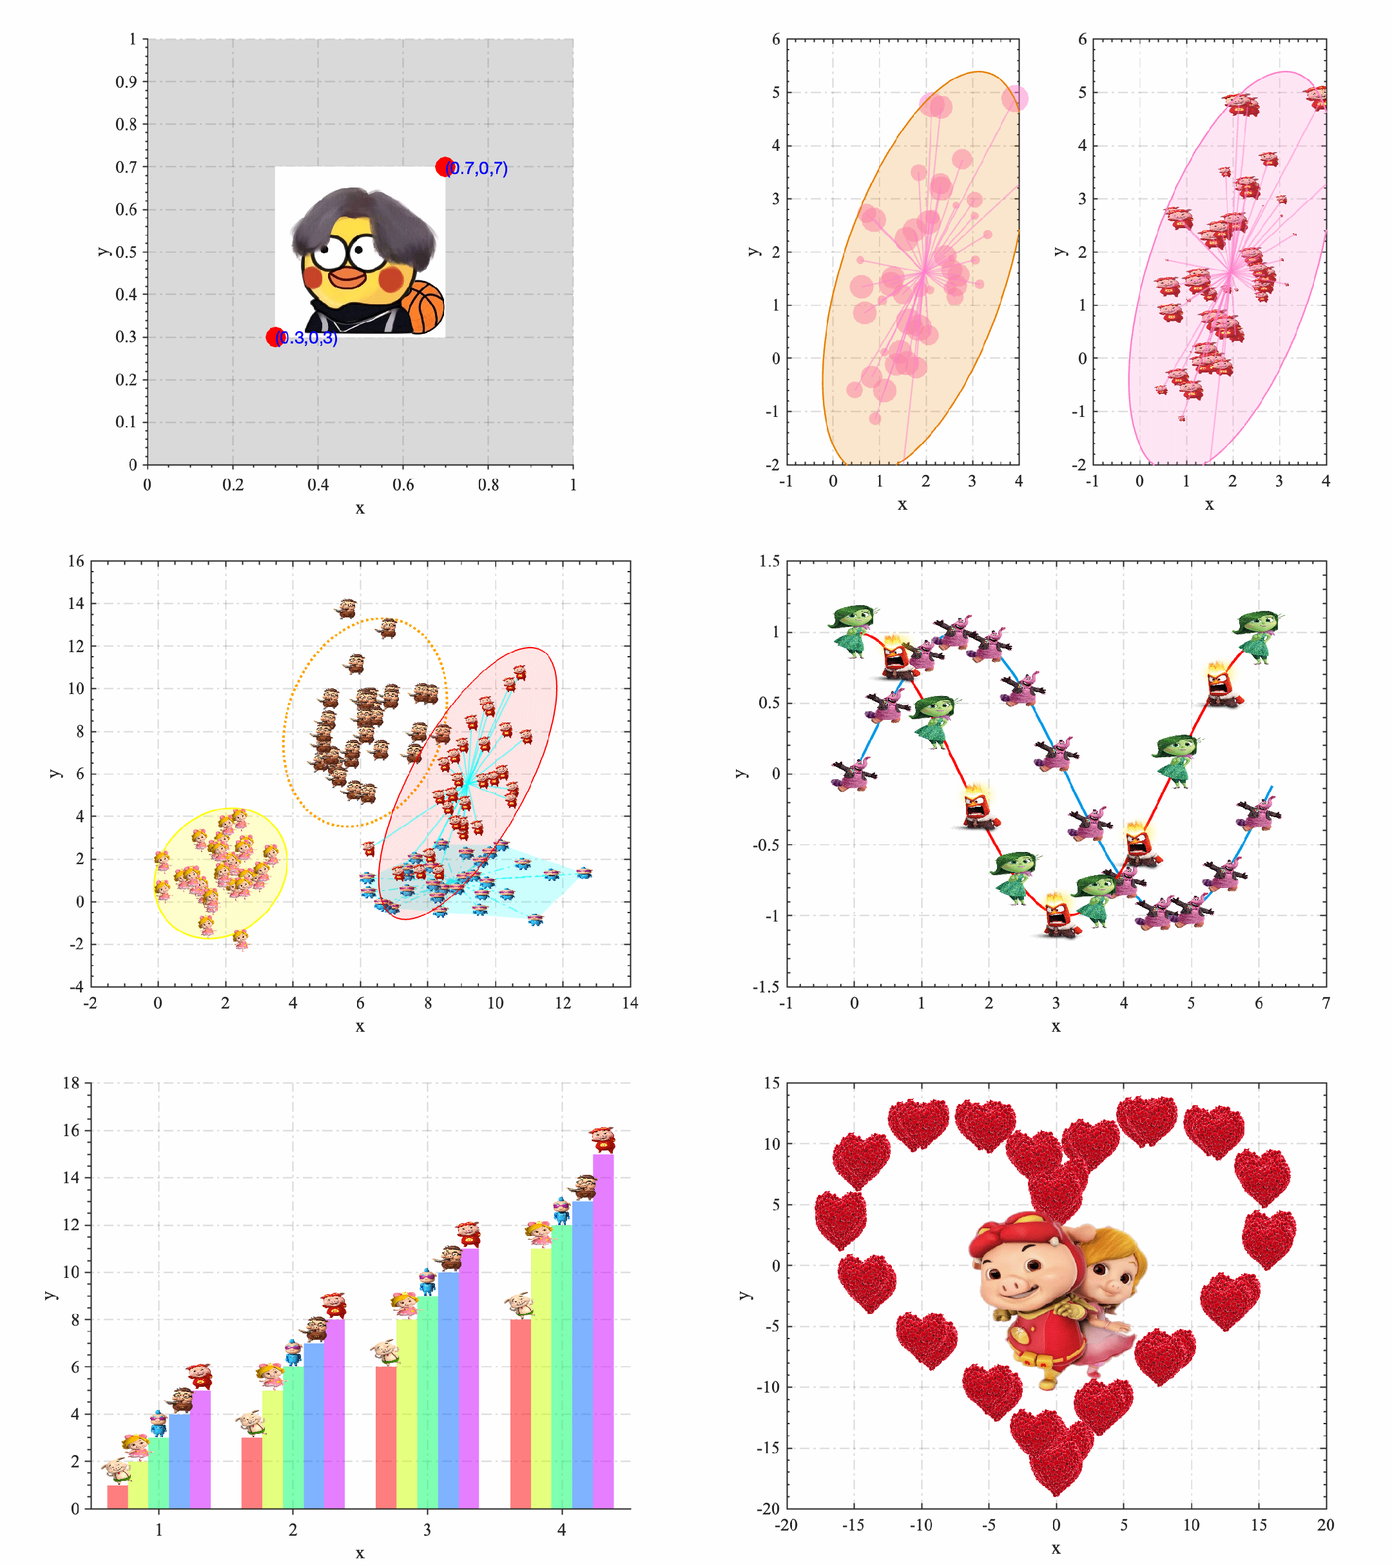
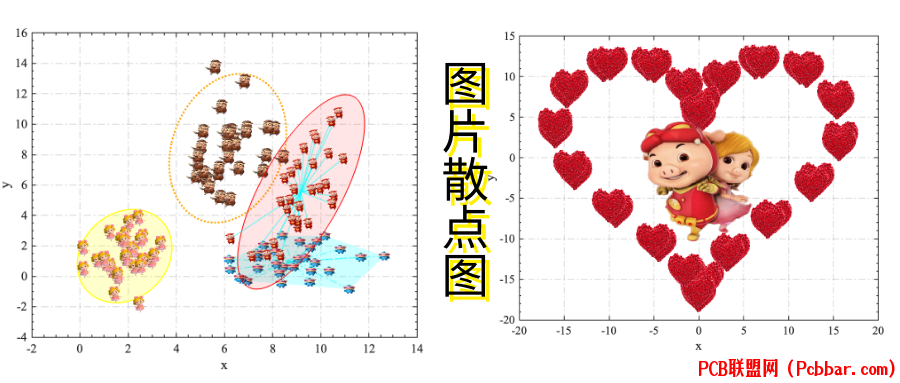
7 R2 a0 u0 i; e _% A5 j7 J今天教大家怎么把散点图替换成自己喜欢的图片,喜欢此推文的小伙伴们记得点赞+关注+分享!
- c& ]0 K( g2 R* v m/ h0 \$ J0 n+ i3 M$ P. N9 b( l T
czhhwduj4mo64024880452.png

( d# m, d; G; R' H# B- D! O) F4 P效果图
- ?- ~1 I- |0 n, t* C+ S* B: Y
3 q T3 [8 G* v& m7 V( E
wguufhadtxc64024880553.gif
 % Z. {0 h3 M; Y0 J0 ?* d3 ~
?
7 R0 p7 C; U7 B' F9 _
! j. R+ G3 q& Y
r1d0n3nnlp164024880653.png
% a4 Q$ Y( z" e) ` l6 T; u' ]3 `, {5 T7 D& U) d
gx3tldsm3zk64024880754.gif
 ! t G& [( Z0 l6 |7 ?1 i" i
/ l% V6 C' E$ }* b ?; i
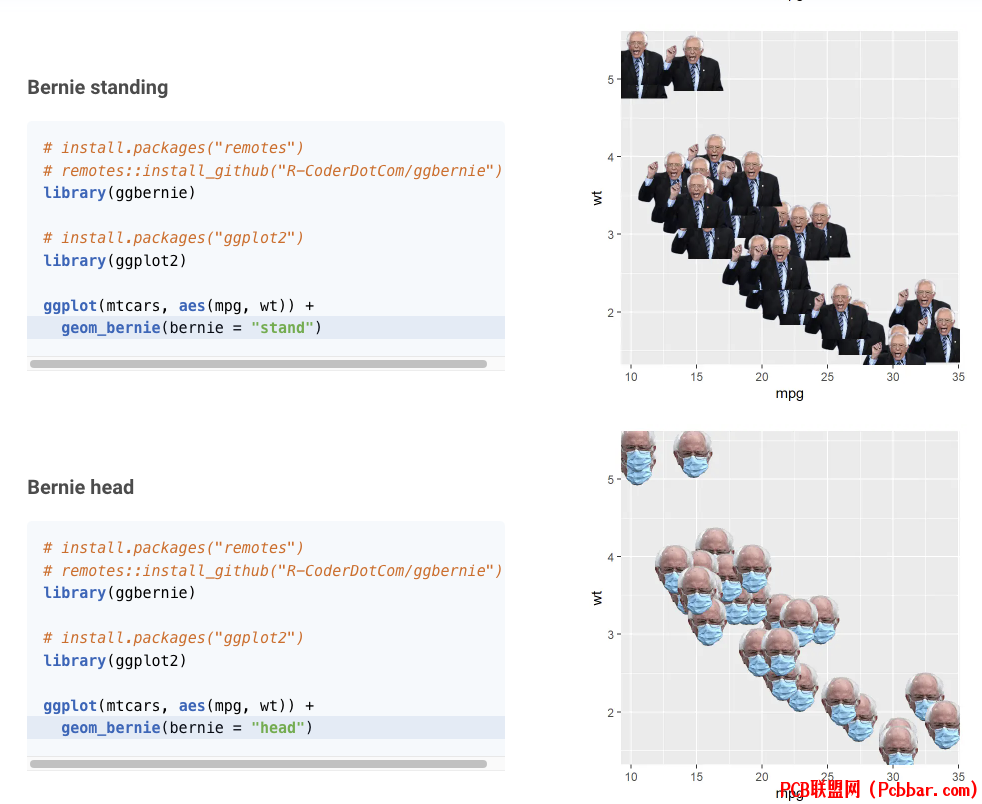
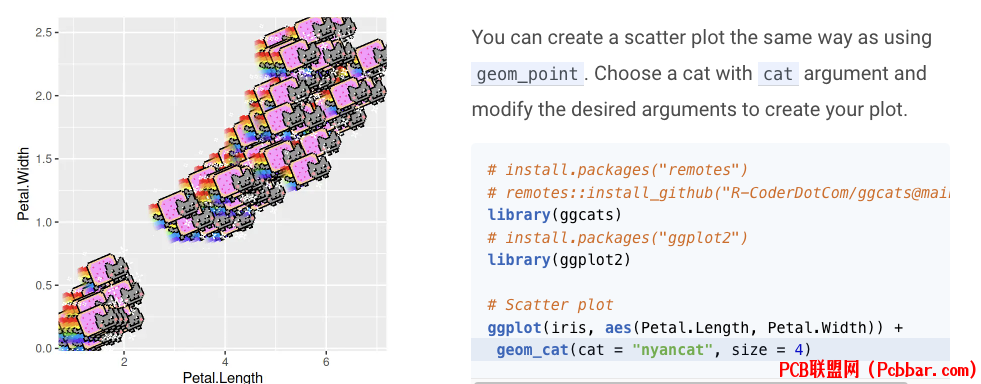
看了slandarer和https://r-charts.com/miscellaneous/ggbernie/思路的启发,我也尝试写一个Matlab的图片散点图的教程。以下是R语言提供的一些案例。
* w' H9 Q6 \9 ~1 p8 N
b5iygvonqil64024880854.png
 0 [1 Q3 L9 j( R; l# M# ^, y) j5 j$ K s
& k b) U3 n+ j% Z5 O' M% X
bed0apowzi264024880954.png
 3 \& `; \! a5 N
$ ?* z" a+ s: s" ]1 D+ m: k
首先介绍一下怎么把图片放到笛卡尔坐标系中。clc;clear;close all; % 清除命令窗口,工作空间,关闭所有图形窗口% 读取图像[A,map,transparency]= imread('pic/猪猪侠/5.png');% 根据图像类型进行转换if isempty(map) if size(A, 3) == 1 % 如果是灰度图像,转换为真彩色 imgRgb = repmat(A, [1 1 3]); else % 如果已经是真彩色图像,则不需要转换 imgRgb = A; endelse % 如果是索引色图像,转换为真彩色 imgRgb = ind2rgb(A, map);end
: R. X, {( \7 k" `8 P# v! _% 反转图像和透明度,以适应坐标系img = flipud(imgRgb);AlphaImg = flipud(transparency);hold on % 保持当前图像,以便在其上添加其他图形元素% 在指定的x和y范围内显示图像image([0.3 0.7],[0.3,0.7],img,"AlphaData", AlphaImg)% 在(0.3, 0.3)和(0.7, 0.7)处绘制红色点plot([0.3 0.7],[0.3 0.7],'ro','MarkerFaceColor','r','MarkerSize',16)% 在点旁边添加文本标签text(0.3,0.3,'(0.3,0,3)','Color','b','FontSize',14)text(0.7,0.7,'(0.7,0,7)','Color','b','FontSize',14)% 获取当前轴并进行设置ax=gca; axis square; % 设置坐标轴为正方形ax.XLim=[0,1]; % 设置x轴的范围ax.YLim=[0,1]; % 设置y轴的范围ax.Color=[1,1,1]*0.85; % 设置轴的背景色ax.LineWidth = 1; % 设置轴线宽度 ]" k* `4 U4 i- ]: N
% 其他轴设置ax.XMinorTick = 'on'; % 打开X轴的次要刻度线ax.YMinorTick = 'on'; % 打开Y轴的次要刻度线ax.TickDir = 'out'; % 设置主要刻度线方向向外ax.GridLineStyle = '-.'; % 设置网格线样式为虚线ax.GridColor = 'k'; % 设置网格线颜色为黑色ax.XGrid = 'on'; % 打开X轴的网格线ax.YGrid = 'on'; % 打开Y轴的网格线
" B1 U1 t; E# [% 字体和标签设置ax.FontSize = 14; % 设置字体大小ax.FontName = 'Times New Roman'; % 设置字体ax.XLabel.String = 'x'; % 设置X轴标签ax.YLabel.String = 'y'; % 设置Y轴标签
" U% K9 w- {, c+ ?0 {
vxmjifr5qy464024881054.jpg

2 x1 J2 L' E" a/ C4 `1 c- U8 h先判断图片的类型,因为数据图片有真彩图片和索引图片,先把索引图片转换为真彩图片,然后flipud反转图像和透明度,反转的目的是为了将图片的坐标系转换成笛卡尔坐标系上。就可以利用image添加图像了,其中AlphaData是透明度属性。
) f5 p' Q' }4 d* W% p f$ h然后准备一下图片数据https://www.stickpng.com/,下载好了保存到一个文件夹中,然后利用下面plotImageScatter绘图的工具函数。
1 {, X! |0 J. I( ^% Q% o ~$ `* V I% ]/ M4 C: M
工具箱函数
: J, m& I) G( ]0 u! b5 Hfunction Hdl=plotImageScatter(x, y, imgPath, coef)% @author:猪猪侠% @Email:2377389590@qq.com% @WeChart:iDmatlab% @公众号:好玩的Matlab% plotImageScatter: 用图片替代散点图的散点% 输入参数:% x - x坐标向量% y - y坐标向量% imgPath - 图像路径% coef - 控制图像大小的系数
. A8 k- q1 S% [4 w& P% 读取图像和透明度数据[A, map, transparency] = imread(imgPath);% 根据图像类型进行转换if isempty(map) if size(A, 3) == 1 % 如果是灰度图像,转换为真彩色 imgRgb = repmat(A, [1 1 3]); else % 如果已经是真彩色图像,则不需要转换 imgRgb = A; endelse % 如果是索引色图像,转换为真彩色 imgRgb = ind2rgb(A, map);end1 C9 F' i/ s8 u' D% Z0 @2 \
% 反转图像和透明度,以适应坐标系img = flipud(imgRgb);AlphaImg = flipud(transparency);- O5 ^7 @' P& ^6 L* F
% 获取当前坐标轴信息ax = gca;xLen = ax.XLim(2) - ax.XLim(1);yLen = ax.YLim(2) - ax.YLim(1);spectRatio = ax.PlotBoxAspectRatio;
# V8 C7 k' K7 h$ b% G% 根据坐标轴范围计算图像的宽度和高度if xLen >= yLen w = xLen; h = yLen / spectRatio(2) * spectRatio(1);else w = xLen / spectRatio(1) * spectRatio(2); h = yLen;end
+ ?# A/ _# b' D% 使用经验系数调整图像大小coef = coef * 0.02; % 0.02为一个经验系数,没有特定的意义% 使用循环绘制每个图像散点for i = 1:length(x) xPic = [-w/2, w/2] * coef(i) + x(i); yPic = [-h/2, h/2] * coef(i) + y(i); % 绘制图像 Hdl(i)=image(xPic, yPic, img, "AlphaData", AlphaImg);endend?其中函数参数:输入参数:
9 H9 _# ]1 c4 S/ Q) P8 }& w& Kx - x坐标向量y - y坐标向量imgPath - 图像路径coef - 控制图像大小的系数输出参数, G" [! a- o( t9 p7 k: Z8 h
Hdl为散点图像的句柄,可根据句柄获取和设置图像的参数。+ h( ]" V' K) Q
0 n5 H9 X2 k. B+ r1 _$ A4 O* m
( }0 d* S/ i6 i% ]5 W1 w: N- m0 j# }, r, Q- N8 U' o
案例19 V+ p- [! e+ e3 Y8 I9 V
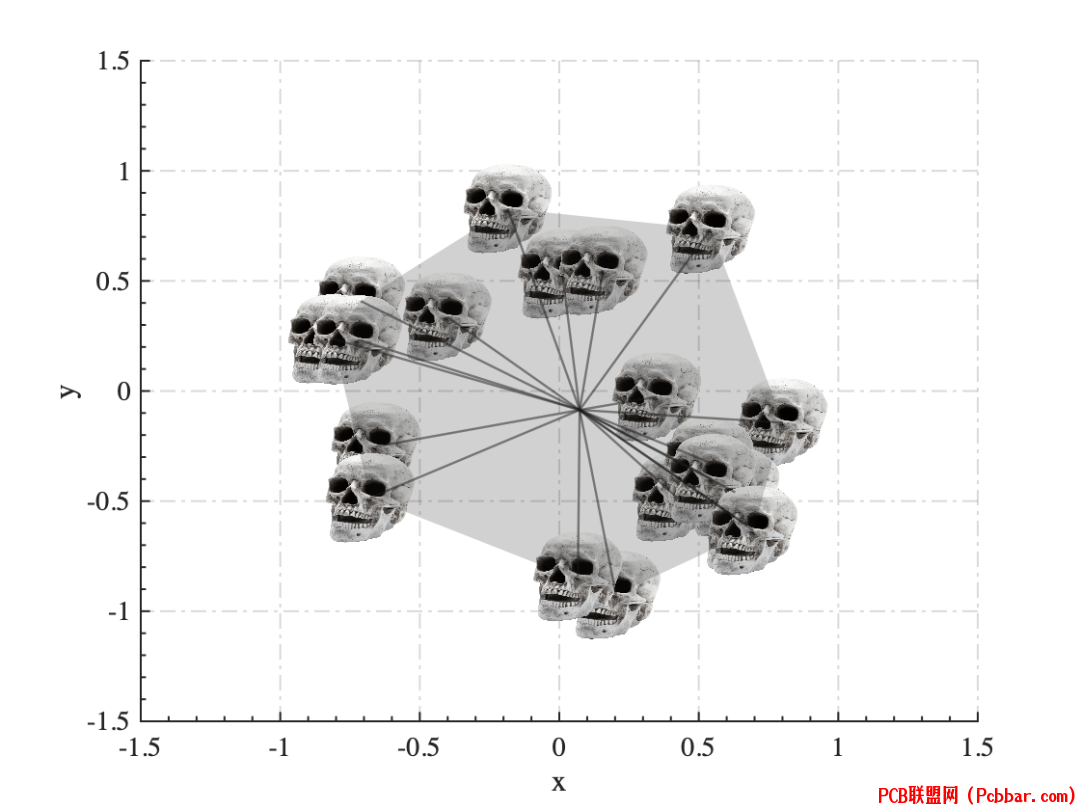
结合上一篇介绍的炫酷聚类散点图的ClusterViz类函数clc;clear;close all; % 清除环境% 生成随机坐标num_points = 20;theta = 2 * pi * rand(1, num_points);r = sqrt(rand(1, num_points));x = r .* cos(theta);y = r .* sin(theta);% a: d3 ^3 {, \& L3 k1 `0 z, k: ^6 C8 [
% 绘制散点图sh1=scatter(x, y,'filled','CData',[0.1,0.1,0.1],'MarkerFaceAlpha',0.5,'MarkerEdgeColor','none','Marker','o');hold oncoef=ones(1,length(x))*8;plotImageScatter(x, y, 'pic/其他图片/1.png', coef); % 调用函数来绘制图像散点图viz1 = ClusterViz(sh1, [x;y]');viz1.PlotTypeState='on';viz1.LineStyle='-';viz1.clusterViz();hold on % 保持当前图形
4 E! f8 E. I6 F/ _0 Bax=gca;% 设置轴属性ax.XLim=[-1.5,1.5];ax.YLim=[-1.5,1.5];ax.LineWidth = 1;ax.XMinorTick = 'on';ax.YMinorTick = 'on';ax.TickDir = 'in';ax.GridLineStyle = '-.'; ax.GridColor = 'k'; ax.XGrid = 'on';ax.YGrid = 'on';ax.FontSize = 14;ax.FontName = 'Times New Roman';ax.XLabel.String = 'x';ax.YLabel.String = 'y';
3 R7 n% I0 k$ \4 X- j- u& \
cd0vxjklwfu64024881154.png
 - l/ \0 y; t/ V0 S* q
2 ~, P) E2 v8 N
( j: E; c& y$ r' l3 T$ e
* f6 S7 O5 m1 x( p6 S: W案例2
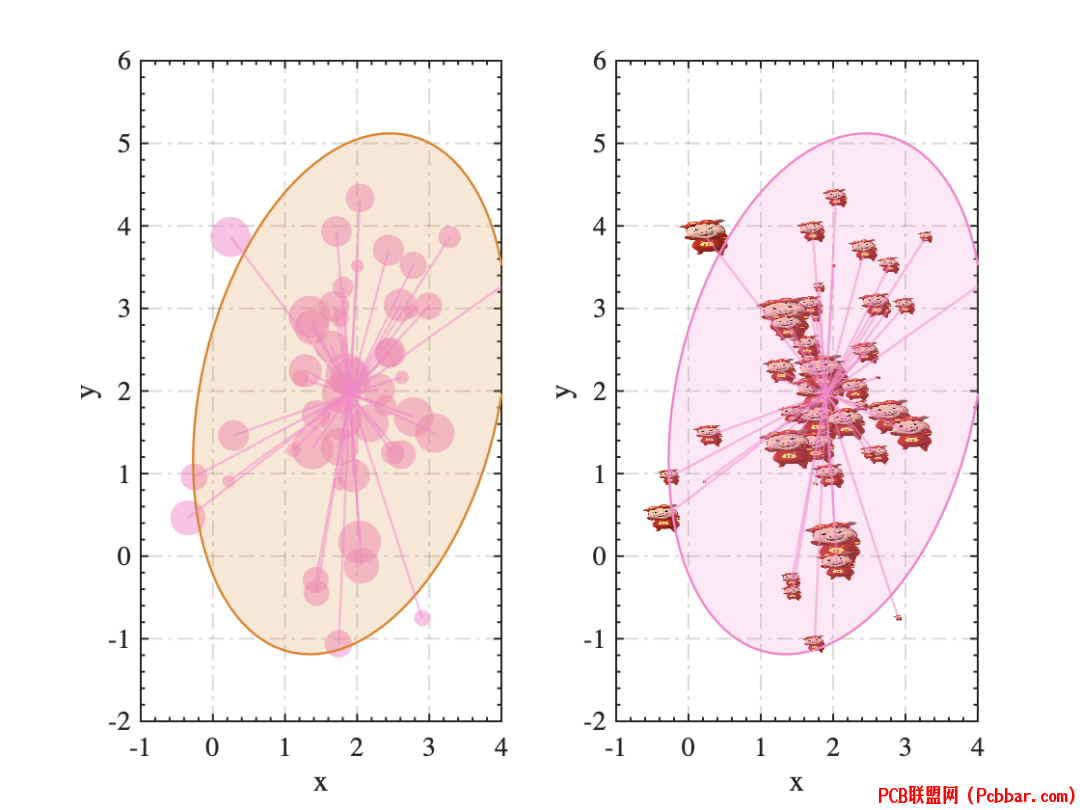
5 ^( l/ w% Z# q" z5 G% h8 l这个也是结合上一篇炫酷聚类散点图怎么绘制椭圆置信区间。clc;clear;close all; % 清空命令窗口、清除所有变量和关闭所有图窗
1 i3 ~( v& k. v4 @" G# m; l- u% 创建随机数据点,并添加噪声data=repmat([2 2],50,1) + randn(50,2)*[1 .5; 0 1.32];x=data(:,1); % x坐标y=data(:,2); % y坐标) @- Q" q& ]. i+ i7 ?* D. B: r
% 生成随机大小因子bigness=rand(1,length(x))*10;. T# ?2 p3 A5 A* @1 b! G0 r0 {
subplot(1,2,1) % 创建一个1行2列的子图,并选择第一个hold on % 保持当前图sh1=scatter(x,y,bigness*50,'filled','CData',[1,0.5,0.8],'MarkerFaceAlpha',0.5,'MarkerEdgeColor','none','Marker','o');confidenceLevel=0.95;ell1 = ConfidenceEllipse(sh1,[x,y], confidenceLevel);ell1.PlotType = 'fill';ell1.Color=[0.9,0.5,0];ell1.plotEllipse();viz1 = ClusterViz(sh1, [x,y]);viz1.PlotTypeState='off';viz1.Color=[1,0.5,0.8];viz1.LineStyle='-';viz1.clusterViz();
" b5 a5 R* L, A. S% 设置第一个子图的轴属性ax=gca;ax.XLim=[-1,4];ax.YLim=[-2,6];ax.LineWidth=1; %线粗ax.Box='on';% 关闭显示坐标区轮廓ax.XMinorTick='on';%打开X轴的次要刻度线ax.YMinorTick='on';%打开Y轴的次要刻度线ax.TickDir='in';% 设置主要刻度线方向向外ax.GridLineStyle='-.'; % 设置网格线样式为虚线ax.GridColor='k'; % 设置网格线颜色为黑色ax.XGrid='on'; % 打开X网格线ax.YGrid='on'; % 打开Y网格线ax.FontSize=14;% 字体大小设置14ax.FontName='Times New Roman';%时代新罗马字体ax.XLabel.String='x';% 设置X轴标签ax.YLabel.String='y';% 设置Ys轴标签
0 F' a6 l4 T, s' q& d% Ysubplot(1,2,2) % 选择第二个子图hold on % 保持当前图coef=bigness; % 设置图像大小coef=coef*5; % 0.02是一个经验系数plotImageScatter(x, y, 'pic/猪猪侠/5.png', coef); % 调用函数来绘制图像散点图plot(x,y,'o','color','none') % 画出数据点ell1 = ConfidenceEllipse(sh1,[x,y], confidenceLevel);ell1.PlotType = 'fill';ell1.plotEllipse();/ o/ A5 A/ x* e% }1 s" T
viz1 = ClusterViz(sh1, [x,y]);viz1.PlotTypeState='off';viz1.Color=[1,0.5,0.8];viz1.LineStyle='-';viz1.clusterViz();
7 f2 _8 A7 e8 `% 获取当前子图的轴ax=gca;% 设置第二个子图的轴属性ax.XLim=[-1,4];ax.YLim=[-2,6];ax.LineWidth=1; %线粗ax.Box='on';% 关闭显示坐标区轮廓ax.XMinorTick='on';%打开X轴的次要刻度线ax.YMinorTick='on';%打开Y轴的次要刻度线ax.TickDir='in';% 设置主要刻度线方向向外ax.GridLineStyle='-.'; % 设置网格线样式为虚线ax.GridColor='k'; % 设置网格线颜色为黑色ax.XGrid='on'; % 打开X网格线ax.YGrid='on'; % 打开Y网格线ax.FontSize=14;% 字体大小设置14ax.FontName='Times New Roman';%时代新罗马字体ax.XLabel.String='x';% 设置X轴标签ax.YLabel.String='y';% 设置Ys轴标签
+ c; T3 t) J$ X1 {( t6 B5 i1 C9 N
1b4otf3epoo64024881254.png
 8 g5 s9 {5 {! r; q8 B% P+ J
# W% `4 r) H9 ]$ k* g, I2 h- S5 b) L
$ Z1 M" t! ]2 h& v0 I* w
案例3% }9 @+ ]* j$ E: n) S
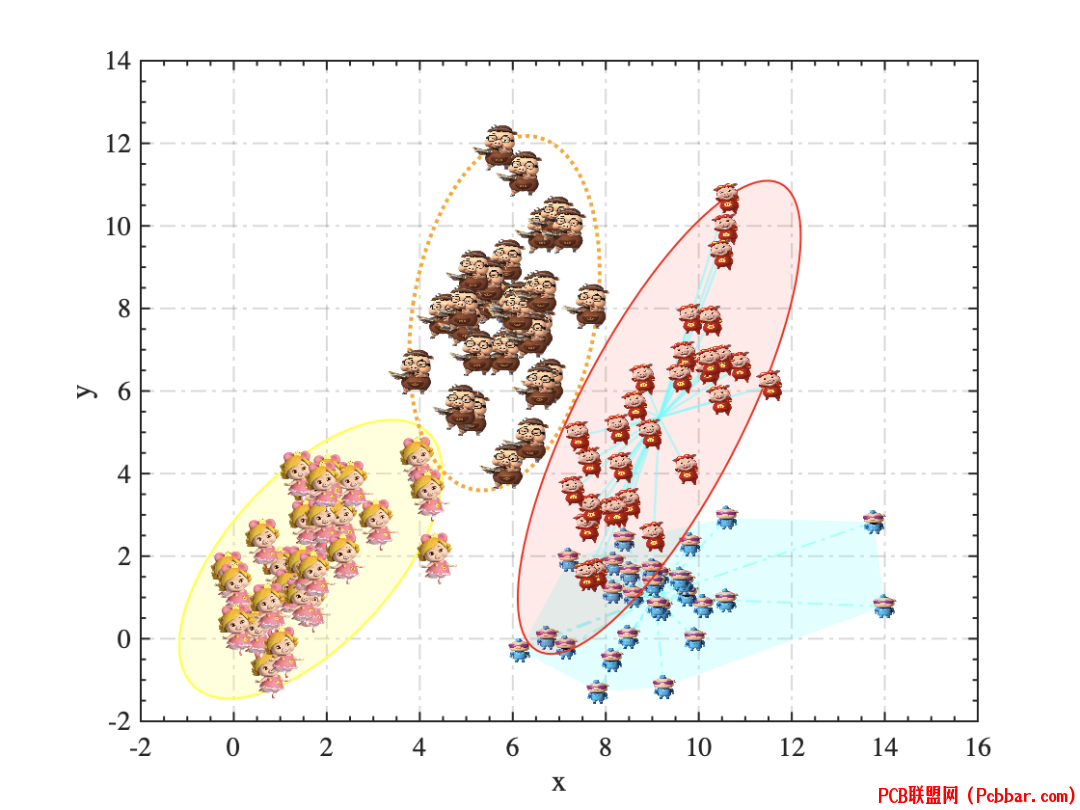
5 a$ p$ ^* p4 ^7 [/ J这也是结合炫酷的聚类散点图综合绘图。
8 m) H: ]( Y$ m( cclc; clear; close all;3 L3 N; c+ a; c
d1=repmat([2 2],30,1) + randn(30,2)*[1 .5; 0 1.32];d2=repmat([9 1],30,1) + randn(30,2)*[1.4 0.2; 0 0.98];d3=repmat([6 8],30,1) + randn(30,2)*[1 0.5; 0 1.7];d4=repmat([9 5],30,1) + randn(30,2)*[1 0.7; 0.5 2];# P- @7 o5 {" v r
sh1=scatter(d1(:,1), d1(:,2),'filled','CData',[1,1,0],'MarkerFaceAlpha',0,'MarkerEdgeColor','none','Marker','o');hold onconfidenceLevel=0.95;ell1 = ConfidenceEllipse(sh1,d1, confidenceLevel);ell1.PlotType = 'fill';ell1.plotEllipse();coef=ones(1,length(d1))*8;plotImageScatter(d1(:,1), d1(:,2), 'pic/猪猪侠/2.png', coef); % 调用函数来绘制图像散点图
2 h3 v7 U! l& g& O' f# {sh2=scatter(d2(:,1), d2(:,2),'filled','CData',[0,1,1],'MarkerFaceAlpha',0,'MarkerEdgeColor','none','Marker','o');viz2 = ClusterViz(sh2, d2);viz2.PlotType='fill';viz2.clusterViz();coef=ones(1,length(d2))*3;plotImageScatter(d2(:,1),d2(:,2), 'pic/猪猪侠/3.png', coef); % 调用函数来绘制图像散点图
, U# k- p: ]9 }; H; Bsh3=scatter(d3(:,1), d3(:,2),'filled','CData',[1,0.6471,0],'MarkerFaceAlpha',0,'MarkerEdgeColor','none','Marker','o');ell3 = ConfidenceEllipse(sh3,d3, confidenceLevel);ell3.PlotType = 'line';ell3.LineStyle=':';ell3.LineWidth=2;ell3.FillAlpha=1;ell3.plotEllipse();coef=ones(1,length(d3))*3;plotImageScatter(d3(:,1),d3(:,2), 'pic/猪猪侠/4.png', coef); % 调用函数来绘制图像散点图
( E0 Q2 z/ A+ _sh4=scatter(d4(:,1), d4(:,2),'filled','CData',[1,0,0],'MarkerFaceAlpha',0,'MarkerEdgeColor','none','Marker','o');ell4 = ConfidenceEllipse(sh4,d4, confidenceLevel);ell4.PlotType = 'fill';ell4.LineStyle='-';ell4.LineWidth=1;ell4.FillAlpha=0.1;ell4.plotEllipse();viz4 = ClusterViz(sh4, d4);viz4.PlotTypeState='off';viz4.Color=[0,1,1];viz4.LineStyle='-';viz4.clusterViz();coef=ones(1,length(d4))*2;plotImageScatter(d4(:,1),d4(:,2), 'pic/猪猪侠/5.png', coef); % 调用函数来绘制图像散点图
# J) K9 _4 x9 Y) l) m8 C8 S% 其他轴设置ax = gca;ax.LineWidth=1; %线粗ax.Box='on';% 关闭显示坐标区轮廓ax.XMinorTick='on';%打开X轴的次要刻度线ax.YMinorTick='on';%打开Y轴的次要刻度线ax.TickDir='in';% 设置主要刻度线方向向外ax.GridLineStyle='-.'; % 设置网格线样式为虚线ax.GridColor='k'; % 设置网格线颜色为黑色ax.XGrid='on'; % 打开X网格线ax.YGrid='on'; % 打开Y网格线ax.FontSize=14;% 字体大小设置14ax.FontName='Times New Roman';%时代新罗马字体ax.XLabel.String='x';% 设置X轴标签ax.YLabel.String='y';% 设置Ys轴标签8 g/ L) N/ f) R/ }+ O
lpxpmlfox2r64024881354.png
 " s: \( ~+ c, Z s& M
- N8 f% i' _0 _! b% A4 V" ~/ j3 R i1 o3 `8 j; Z
1 e L8 q% Y/ a6 L1 t) R2 S3 t
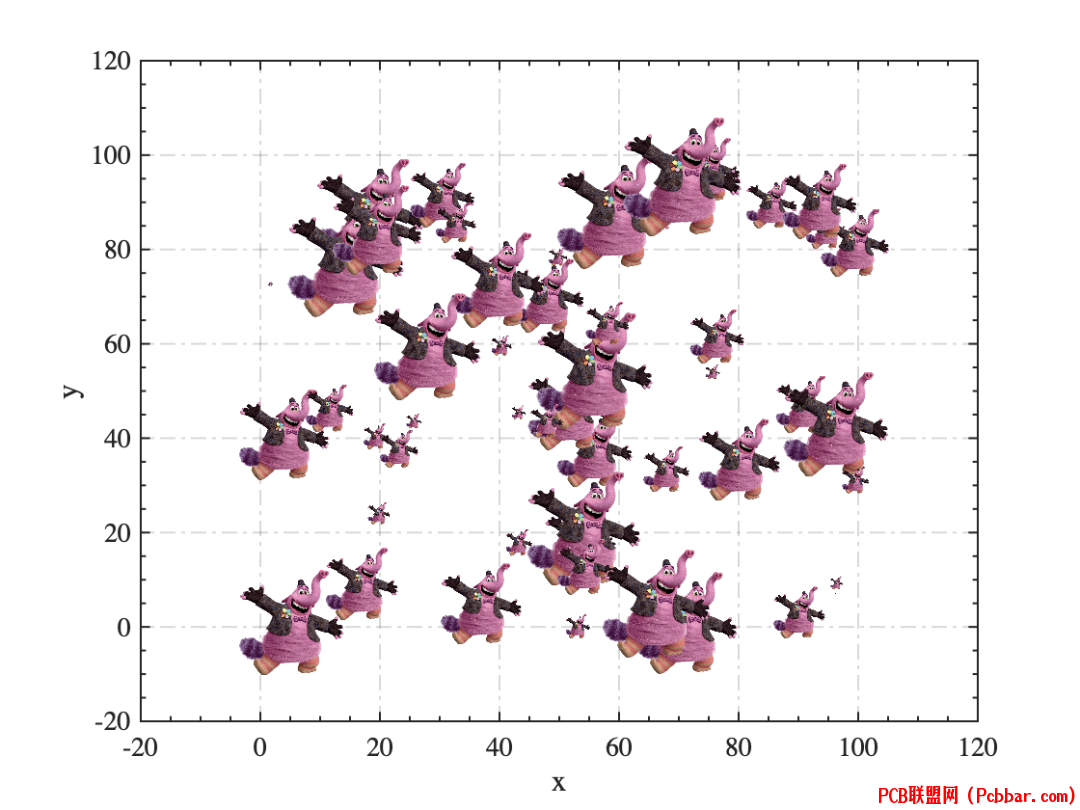
案例4
8 Z9 J. e; U+ p+ F1 j% t图片散点图基础绘制方法。
4 F( ^! W) f) D/ d+ A9 Gclc; clear; close all;5 u7 m! u9 M8 @
x = rand(1, 50) * 100;y = rand(1, 50) * 100; N- ?& }5 f# T) V! ^
scatter(x, y, 'filled','CData',[1,0.5,0.8],'MarkerFaceAlpha',0,'MarkerEdgeColor','none','Marker','o');8 L: ]* c" x! l+ e0 `/ y( O0 m
hold on;coef=rand(1,length(x))*10;hArray=plotImageScatter(x, y, 'pic/头脑特工队/4.png', coef); % 调用函数来绘制图像散点图% delete(hArray);% 其他轴设置ax = gca;ax.LineWidth=1; %线粗ax.Box='on';% 关闭显示坐标区轮廓ax.XMinorTick='on';%打开X轴的次要刻度线ax.YMinorTick='on';%打开Y轴的次要刻度线ax.TickDir='in';% 设置主要刻度线方向向外ax.GridLineStyle='-.'; % 设置网格线样式为虚线ax.GridColor='k'; % 设置网格线颜色为黑色ax.XGrid='on'; % 打开X网格线ax.YGrid='on'; % 打开Y网格线ax.FontSize=14;% 字体大小设置14ax.FontName='Times New Roman';%时代新罗马字体ax.XLabel.String='x';% 设置X轴标签ax.YLabel.String='y';% 设置Ys轴标签, L" ~( k0 x/ N$ }4 T* Z
4h22fauzr4d64024881455.png
 ' o; y( |: n8 F* y; }8 k# I0 `4 R
0 v- C- e: v' F. V+ N; Y3 B. `
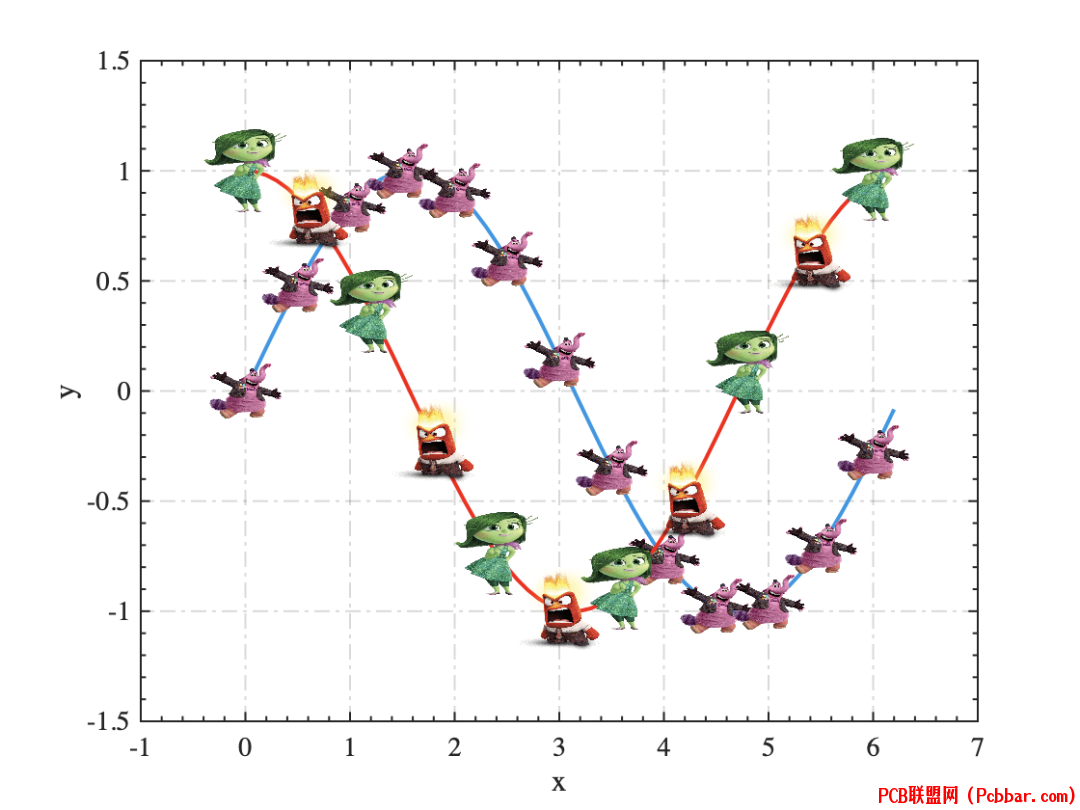
# c0 }1 K7 ?5 ]2 f x P; e) Z案例5* \6 \' V) s; T( k" ^8 `
绘制曲线图+散点图片。clc;clear;close all;x=0:0.1:2*pi;y=sin(x);y2=cos(x);plot(x,y,'-','LineWidth',2,'color',[0 0.6, 0.9])
7 m m# H; R' M4 V/ l& Shold oncoef=ones(1,length(x))*5;plotImageScatter(x(1:5:end), y(1:5:end), 'pic/头脑特工队/4.png', coef); % 调用函数来绘制图像散点图plot(x,y2,'r-','LineWidth',2)xi=x(1:6:end);yi=y2(1:6:end);plotImageScatter(xi(1:2:end), yi(1:2:end), 'pic/头脑特工队/2.png', coef); % 调用函数来绘制图像散点图plotImageScatter(xi(2:2:end), yi(2:2:end), 'pic/头脑特工队/6.png', coef); % 调用函数来绘制图像散点图% 坐标系修饰ax = gca;ax.LineWidth=1; %线粗ax.Box='on';% 关闭显示坐标区轮廓ax.XMinorTick='on';%打开X轴的次要刻度线ax.YMinorTick='on';%打开Y轴的次要刻度线ax.TickDir='in';% 设置主要刻度线方向向内ax.GridLineStyle='-.'; % 设置网格线样式为虚线ax.GridColor='k'; % 设置网格线颜色为黑色ax.XGrid='on'; % 打开X网格线ax.YGrid='on'; % 打开Y网格线ax.FontSize=14;% 字体大小设置14ax.FontName='Times New Roman';%时代新罗马字体ax.XLabel.String='x';% 设置X轴标签ax.YLabel.String='y';% 设置Ys轴标签0 {$ {8 D& \1 y( ~& e
whhqvdh3kdx64024881555.png
: X7 N. b: V, c4 V% l
, @) L& b+ F) a/ g9 J7 T$ v
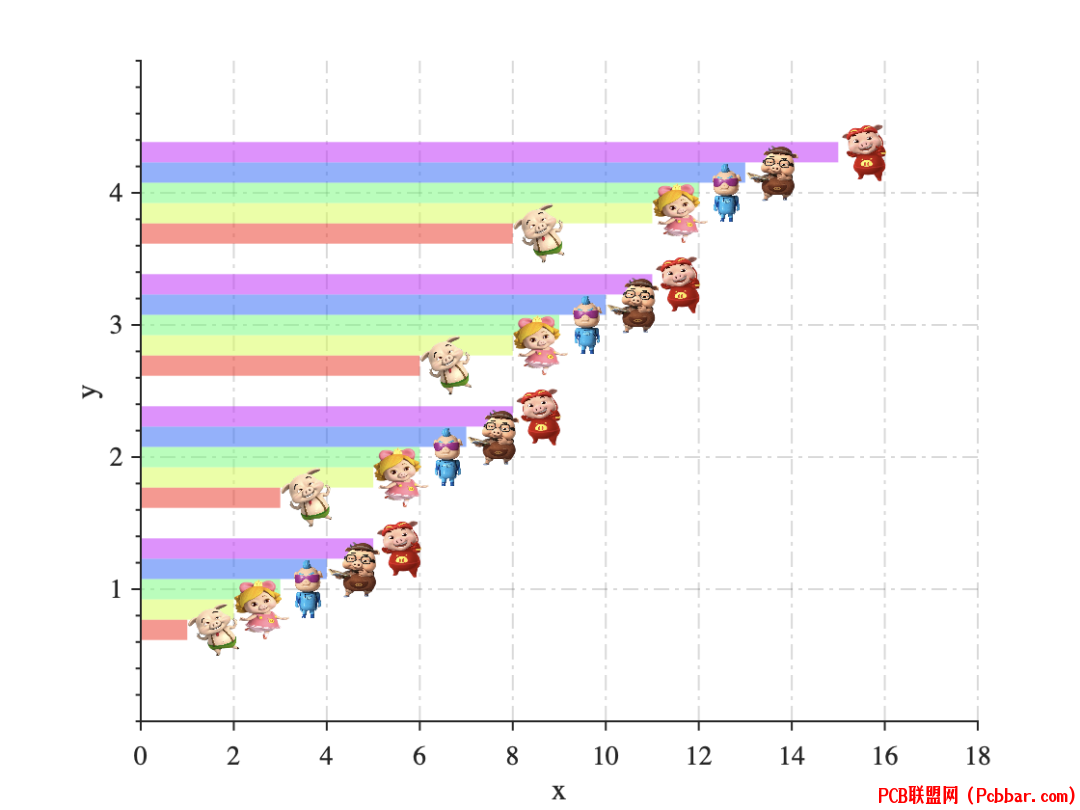
1 f1 s2 h4 C+ S3 a$ b" i }1 H& d案例6
, L: M8 ]) {* @+ m; P, ?8 c8 `绘制柱状图,并在柱状图添加散点图片。
/ Q8 O) D7 [2 A" n# y$ I wclc;clear;close all;% 输入数据: X. s% ~$ g4 Z/ @
y = [1 2 3 4 5; 3 5 6 7 8; 6 8 9 10 11; 8 11 12 13 15];x = 1:size(y,1);
1 \8 N* L3 P/ N+ K- Q% 创建柱状图并获取句柄width =1;bh = bar(x,y, 'BarWidth', width ); % 注意:BarWidth 设置为1,这是默认值colorList=hsv(length(bh));% 初始化顶点坐标存储变量xTops = cell(size(y,2), 1);yTops = cell(size(y,2), 1);
/ X( D7 @7 W2 I* a3 ^0 \6 }' z" |% 循环遍历每个柱状图对象(每一组)for i = 1:length(bh) xData = bh(i).XData; % x坐标(柱子组中心) yData = bh(i).YData; % y坐标(柱子高度) % 计算每根柱子的顶点x坐标(基于柱子中心) xTops{i} =bh(i).XEndPoints; % y坐标就是柱子的高度 yTops{i} = yData;% 现在 xTops 和 yTops 分别包含了各个柱子的顶部 x 和 y 坐标 bh(i).FaceColor=colorList(i,:); bh(i).FaceAlpha=0.5; bh(i).EdgeColor='none';end
; t. K3 q; @8 ]hold oncoef=ones(1,length(x))*4;for i=1:size(y,2) for j=1:size(y,1) plotImageScatter( xTops{i}(j), yTops{i}(j)+0.6, ['pic/猪猪侠/',num2str(i),'.png'], coef); % 调用函数来绘制图像散点图 endend
- Y2 w( X5 b! Tax = gca; % 获取当前轴(axis)的句柄ax.Box='off'; % 关闭轴边框ax.LineWidth = 1; % 设置轴线宽度为1ax.XMinorTick = 'off'; % 关闭X轴的次要刻度线ax.YMinorTick = 'on'; % 打开Y轴的次要刻度线ax.TickDir = 'out'; % 设置主要刻度线方向向外ax.GridLineStyle = '-.'; % 设置网格线样式为虚线ax.GridColor = 'k'; % 设置网格线颜色为黑色(注意注释中的"红色"是不准确的)ax.XGrid = 'on'; % 打开X轴的网格线ax.YGrid = 'on'; % 打开Y轴的网格线ax.FontSize = 14; % 设置字体大小为14ax.FontName = 'Times New Roman'; % 设置字体为Times New Romanax.XLabel.String = 'x'; % 设置X轴标签ax.YLabel.String = 'y'; % 设置Y轴标签6 n% c: E+ V+ ?" P
dopfckjxh3i64024881655.png
 . z+ @' S* }. M2 X. ^3 x5 ~; t
1 E, h6 Q: `$ H; k' k
ob0ly2jc2xi64024881755.png
b7 o! U9 d: z. k6 w: L6 M8 i
( I6 R( b& F( ?3 L4 C$ P
- H$ F. p2 {4 ?6 |: B9 e" ~! n! {
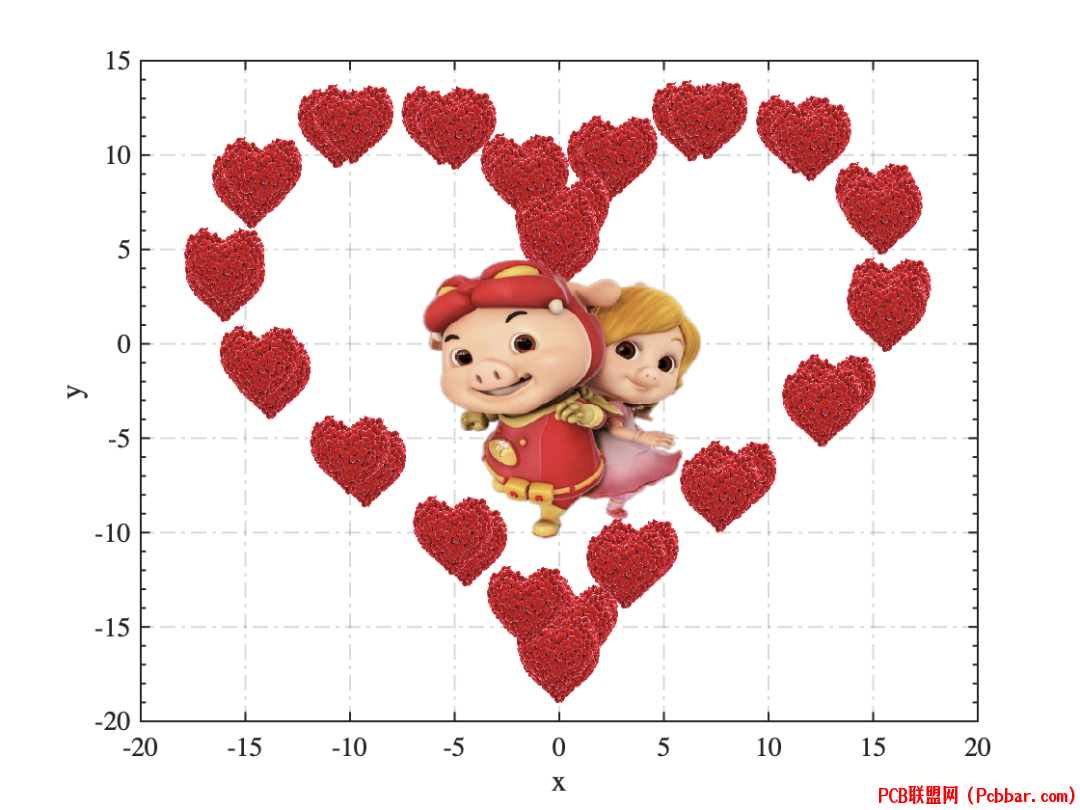
案例7
8 z& r& M# i+ I5 F& o利用散点图片绘制有趣的表白代码clc;clear;close allt=0:0.025:4*pi;x=16*sin(t).^3;y=13*cos(t)-5*cos(2*t)-2*cos(3*t)-cos(4*t);plot(x,y,'.','color','none')hold oncoef=ones(1,length(x))*5;plotImageScatter(x(1:11:end), y(1:11:end), 'pic/其他图片/5.png', coef); % 调用函数来绘制图像散点图plotImageScatter(0, -3, 'pic/猪猪侠/7.png', 18); % 调用函数来绘制图像散点图5 @3 a+ |3 ^1 {4 B
ax = gca; % 获取当前轴(axis)的句柄ax.LineWidth = 1; % 设置轴线宽度为1ax.XMinorTick = 'off'; % 关闭X轴的次要刻度线ax.YMinorTick = 'on'; % 打开Y轴的次要刻度线ax.TickDir = 'in'; % 设置主要刻度线方向向外ax.GridLineStyle = '-.'; % 设置网格线样式为虚线ax.GridColor = 'k'; % 设置网格线颜色为黑色(注意注释中的"红色"是不准确的)ax.XGrid = 'on'; % 打开X轴的网格线ax.YGrid = 'on'; % 打开Y轴的网格线ax.FontSize = 14; % 设置字体大小为14ax.FontName = 'Times New Roman'; % 设置字体为Times New Romanax.XLabel.String = 'x'; % 设置X轴标签ax.YLabel.String = 'y'; % 设置Y轴标签
8 s, b/ O5 j, @1 j
m441lbrfo3k64024881855.png
1 g) C$ E* z5 a% i; g# x+ }& |0 c
6 i6 m6 T+ y8 I* g2 t
$ p3 }/ W, U8 E+ B" t$ e( w
4 i0 d" t w# i案例8& w$ W6 b2 r' f7 J" L0 g2 E
绘制动态的图。clc;clear;close all;t=linspace(0,2*pi,200);x=sin(t)*2;y=cos(t)*2;plotHdl=plot(x(1),y(1),'-','LineWidth',2,'color','none');hold on% 设置gca 属性ax=gca;ax.XLim=[-3,3];ax.YLim=[-3,3];ax.Box='off'; % 关闭轴边框ax.LineWidth = 1; % 设置轴线宽度为1ax.XMinorTick = 'on'; % 关闭X轴的次要刻度线ax.YMinorTick = 'on'; % 打开Y轴的次要刻度线ax.TickDir = 'in'; % 设置主要刻度线方向向外ax.GridLineStyle = '-.'; % 设置网格线样式为虚线ax.GridColor = 'k'; % 设置网格线颜色为黑色(注意注释中的"红色"是不准确的)ax.XGrid = 'on'; % 打开X轴的网格线ax.YGrid = 'on'; % 打开Y轴的网格线ax.FontSize = 14; % 设置字体大小为14ax.FontName = 'Times New Roman'; % 设置字体为Times New Romanax.XLabel.String = 'x'; % 设置X轴标签ax.YLabel.String = 'y'; % 设置Y轴标签( N) N/ z, H. d3 B$ |
coef=ones(1,length(x))*15;Hdl1=plotImageScatter(x(1), y(1), 'pic/其他图片/ship1.png', coef); % 调用函数来绘制图像散点图Hdl2=plotImageScatter(x(1), y(1), 'pic/其他图片/ship2.png', coef); % 调用函数来绘制图像散点图Hdl3=plotImageScatter(x(1), y(1), 'pic/其他图片/ship3.png', coef); % 调用函数来绘制图像散点图3 S X9 ]' S5 j" V( @
startPosX=Hdl1(1).XData-x(1);startPosY=Hdl1(1).YData-y(1);% 循环生成动画帧并保存为GIFgifFileName = 'example.gif';% 设置GIF文件名for n = 1:length(x)
/ c* I% W. C# Z# E% T plotHdl.XData(n) = x(n); plotHdl.YData(n) = y(n); if mod(n - 1, 3) + 1==1 Hdl1.Visible='on'; Hdl2.Visible='off'; Hdl3.Visible='off'; elseif mod(n - 1, 3) + 1==2 Hdl1.Visible='off'; Hdl2.Visible='on'; Hdl3.Visible='off'; elseif mod(n - 1, 3) + 1==3 Hdl1.Visible='off'; Hdl2.Visible='off'; Hdl3.Visible='on'; end# Y# R' P' p# y* l7 q, |5 }0 g5 `
Hdl1.XData(:)=startPosX+x(n); Hdl1.YData(:)=startPosY+y(n);
. z( v5 s( B8 x/ n- U( ] Hdl2.XData(:)=startPosX+x(n); Hdl2.YData(:)=startPosY+y(n); f& u# Y) c& t' _
Hdl3.XData(:)=startPosX+x(n); Hdl3.YData(:)=startPosY+y(n); drawnow pause(0.01); % 获取当前帧 frame = getframe(gcf); % 将帧转换为索引图像和颜色图 [imind, cm] = rgb2ind(frame.cdata, 256);
' Z. N0 p1 I1 w; A6 P: Q % 写入GIF文件 if n == 1 imwrite(imind, cm, gifFileName, 'gif', 'Loopcount', inf, 'DelayTime', 0.1); else imwrite(imind, cm, gifFileName, 'gif', 'WriteMode', 'append', 'DelayTime', 0.1); end
& R" N# j0 W V8 U& X5 Jend
[" g; r, {& U0 G! S6 d8 `! ? v4 B, t" H
' S" y4 b! C4 H2 Z- }, z5 w
6 M7 f1 I& q7 u7 ^; l- ]) X- -THE END- -/ n4 ~0 _! ]8 b% l* y/ w
源码下载:gitee下载:https://gitee.com/iDMatlab/image-scatter" L( A1 @6 u# b( K/ E
teuhsuel0lw64024881955.png
 ( s! K) p3 U% ]- z* L2 C
参考资料:
4 H+ Z" h! o" P- G【1】图片素材下载:https://www.stickpng.com/【2】https://r-charts.com/miscellaneous/ggcats/【3】https://www.mathworks.com/help/releases/R2021b/matlab/ref/image.html【4】https://ww2.mathworks.cn/help/matlab/creating_plots/manipulating-axes-aspect-ratio.html- T) a. {" y0 F" J% Q
yeaqsjd0biw64024882055.gif
 ; y2 ^# |6 f4 `; T1 X5 |1 \
0huwn0ablrj64024882155.png

- @% O0 b* J/ o8 G% u送书活动
% p5 L& m0 p- [% p' [
p32ft3r2fsk64024882255.png

; G3 d! j+ `/ u! A/ {- t! { * k6 S1 K j$ E6 \+ t( u z' [- B1 J * k6 S1 K j$ E6 \+ t( u z' [- B1 J
! O1 r/ P$ I7 C" M& S: E
包邮赠送 「北京大学出版社」赞助《3D科研绘图与学术图表绘制从入门到精通》
9 f! I" ^ M+ w1 @6 h/ a% w3 w+ ~* X本书共7章,系统讲解了化学、材料学、生物医学等领域的作图需求和相关软件技术,并从设计基本概念、软件底层原理和案例实际操作三个方面展开全方位的教学。本书在内容的设定和案例的选择上充分考虑了读者对象的需求,无论是刚入门的初学者还是寻求深度发展的科学可视化人员,都能从中汲取所需的知识。特别是涉及专业科学可视化部分的内容,有效填补了现有同类型参考书的空白。本书专为有图像设计需求的研究人员和科学可视化从业者编写。了解更多- D" W' V2 ^4 [7 A0 n/ n, o K
▼▼▼
( {; @3 a! m K: T
7 u3 `4 r; I% G: H' j9 K【抽奖方式和条件】:0 ^2 X6 }4 Z/ f
1.关注「好玩的MATLAB 」公众号和视频号;# {1 M: ~* T$ P
 4 W6 h! b- v* f2 }* W- n 4 W6 h! b- v* f2 }* W- n
2.给本文点【赞】+【在看】; K& s5 o+ W+ h+ _9 A
3.留言区评论点赞最多的前5名;
# r+ d& V* H) ]7 b$ x7 b4.本活动只针对从未获过奖的同学,之前获过奖的小伙伴,不用参加。3 G/ S& F: n; Y" u4 Y' x1 f
同时满足上述4个条件的读者朋友,包邮赠送一本。 U' U3 |: U; x
【开奖时间】:2023年9月1日夜晚8点 m+ a6 R3 G3 Y- s
【领奖方式】:在开奖时加小编私人微信:idmatlab2 I6 |0 a0 M% r6 J- b" ^
扫一扫加管理员微信, v' h7 c. I8 a9 E& Z' g6 L

8 a; y0 {. e0 M4 @: L |
|