点击上方蓝字和“好玩的MATLAB”一起快乐玩耍吧!0 G: f* G' H/ R; o1 Z
wxqk4qje1jf64027193842.jpg

; A1 Y9 S9 J) |* V好玩的matlab+ r; T0 w: Q* \; T# c$ ^
带你解锁不一样的matlab新玩法% L$ g0 i3 e" U# A% u
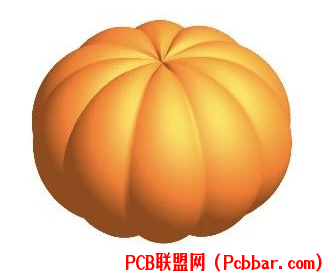
9 F! r2 G5 ]% u* h% x% Y万圣节??到了,今天介绍一下怎么用 MATLAB 整活,喜欢此推文的小伙伴们记得点赞+关注+分享!【尊重作者劳动成果,转载请注明推文链接和公众号名】
: ~: W, o2 C$ @* r$ D9 c3 H效果图
H' U h1 {) {9 d" c
1o3gpnchmwk64027193942.png

0 N _/ k4 [$ w0 @; ? Z, Z7 z! f* P9 p' v. ]- C6 A
xuhohmnzdk464027194043.gif

3 {1 y1 j( r- \- Y6 S" e9 a( W$ R% h代码绘制南瓜clc;clear;close all;[X,Y,Z]=sphere(200);R=1+(-(1-mod(0:.1:20,2)).^2)/15;surf(R.*X,R.*Y,(.8+(0-(1:-.01:-1)'.^4)*.2).*Z.*R,'FaceC',[ 1 0.4588 0.0941],'EdgeC','n')axis('equal','off')material([ .6, .9, .3, 2, .5 ])lighting gcamlight
8 j: }. F2 T2 W
go43syebxb064027194143.png

o5 k, u; X% R7 x绘制无脸男小鬼: U& v% `2 C4 r6 P: F9 D
clc;clear;close allfig=figure('Position',[476 224 672 642]);ax=gca;ax.Color='none';ax.YLim=[0,15];ax.XLim=[-3,14];ax.Box='off';ax.XColor='none';ax.YColor='none';axis equal;hold onpause(0.1)[X, Y] = meshgrid(linspace(1, 0, 200));image([-3, 14], [0, 15], Y*255);colormap(gray)pause(0.1)ellipse = EllipsePlotter('a', 4, 'b', 6, 'x', 5.4, 'y', 6.2, ... 'plotType', 'fill', 'fillColor', [.4,.4,.4], 'rotation', 0, ... 'angleRange',[-25,205],'alpha',1,'lineWidth',6,'lineColor',[1,1,1]*0.9);ellipse.plotEllipse();d=[0 -0.3 -0.4 -0.6 -0.4 -0.3 0];for i=1:7 ellipse = EllipsePlotter('a',1.2, 'b', 3.3, 'x', 2.7+(i-1)*0.9, 'y', 5.5+d(i), ... 'plotType', 'fill', 'fillColor',[.4,.4,.4], 'rotation', 0, ... 'angleRange',[-200,20],'alpha',1,'lineWidth',6,'lineColor','none'); ellipse.plotEllipse();end% 脸pause(0.3)FaceColor=[1.0 0.9627 0.9235];ellipse = EllipsePlotter('a',3, 'b', 2.8, 'x',5.4, 'y',9, ... 'plotType', 'fill', 'fillColor',FaceColor, 'rotation', 0, ... 'angleRange',[0,360],'alpha',1,'lineWidth',2,'lineColor','none');ellipse.plotEllipse();% 眉毛、腮红、嘴pause(0.3)ellipse = EllipsePlotter('a',0.3, 'b',1, 'x',3.9, 'y',10.2, ... 'plotType', 'fill', 'fillColor',[1.0 0.65 0.63], 'rotation', 15, ... 'angleRange',[0,360],'alpha',1,'lineWidth',2,'lineColor','none');ellipse.plotEllipse();
$ r) ^( {. S( M# ^. yellipse = EllipsePlotter('a',0.3, 'b',1, 'x',6.8, 'y',10.4, ... 'plotType', 'fill', 'fillColor',[1.0 0.65 0.63], 'rotation', 160, ... 'angleRange',[0,360],'alpha',1,'lineWidth',2,'lineColor','none');ellipse.plotEllipse();ellipse = EllipsePlotter('a',0.3, 'b',1, 'x',7, 'y',7.8, ... 'plotType', 'fill', 'fillColor',[1.0 0.65 0.63], 'rotation', 0, ... 'angleRange',[-200,20],'alpha',1,'lineWidth',2,'lineColor','none');ellipse.plotEllipse();ellipse = EllipsePlotter('a',0.3, 'b',1, 'x',4, 'y',7.6, ... 'plotType', 'fill', 'fillColor',[1.0 0.65 0.63], 'rotation', -10, ... 'angleRange',[-200,20],'alpha',1,'lineWidth',2,'lineColor','none');ellipse.plotEllipse();pause(0.3)ellipse = EllipsePlotter('a',.84, 'b',1.1, 'x',3.9, 'y',8.9, ... 'plotType', 'fill', 'fillColor',FaceColor, 'rotation', 0, ... 'angleRange',[0,360],'alpha',1,'lineWidth',2,'lineColor','none');ellipse.plotEllipse();ellipse = EllipsePlotter('a',.84, 'b',1.2, 'x',7, 'y',9, ... 'plotType', 'fill', 'fillColor',FaceColor, 'rotation', 0, ... 'angleRange',[0,360],'alpha',1,'lineWidth',2,'lineColor','none');ellipse.plotEllipse();%嘴巴pause(0.3)ellipse = EllipsePlotter('a',.3, 'b',.5, 'x',5.3, 'y',7.9, ... 'plotType', 'fill', 'fillColor',[0.9 0 0], 'rotation', 0, ... 'angleRange',[-180,0],'alpha',1,'lineWidth',2,'lineColor','none');ellipse.plotEllipse();& s; r# H* C1 g. F1 i3 \
ellipse = EllipsePlotter('a',.5, 'b',.25, 'x',5.3, 'y',8, ... 'plotType', 'fill', 'fillColor',FaceColor, 'rotation', 0, ... 'angleRange',[-180,0],'alpha',1,'lineWidth',2,'lineColor','none');ellipse.plotEllipse();%眼袋pause(0.2)ellipse = EllipsePlotter('a',0.3, 'b',0.1, 'x',3.9, 'y',8.2, ... 'plotType', 'fill', 'fillColor',[1 1 1]*0.8, 'rotation', 0, ... 'angleRange',[0,360],'alpha',1,'lineWidth',2,'lineColor','none');ellipse.plotEllipse();ellipse = EllipsePlotter('a',0.3, 'b',0.11, 'x',7, 'y',8.2, ... 'plotType', 'fill', 'fillColor',[1 1 1]*0.8, 'rotation', 0, ... 'angleRange',[0,360],'alpha',1,'lineWidth',2,'lineColor','none');ellipse.plotEllipse();% 眼睛pause(0.3)ellipse = EllipsePlotter('a',0.7, 'b',0.6, 'x',3.9, 'y',9.1, ... 'plotType', 'fill', 'fillColor',[0 0 0], 'rotation', 0, ... 'angleRange',[0,360],'alpha',1,'lineWidth',2,'lineColor','none');ellipse.plotEllipse();ellipse = EllipsePlotter('a',0.7, 'b',0.6, 'x',7, 'y',9.1, ... 'plotType', 'fill', 'fillColor',[0 0 0], 'rotation', 0, ... 'angleRange',[0,360],'alpha',1,'lineWidth',2,'lineColor','none');ellipse.plotEllipse();% 心pause(0.3)t=0:0.025:2*pi;x=(16*sin(t).^3)/10+5.5;y=(13*cos(t)-5*cos(2*t)-2*cos(3*t)-cos(4*t))/10+4.8;fill(x,y,'r','edgecolor','r');%风车pause(0.3)plot([0 0.2],[9.5 7],'LineWidth',3,'Color',[0,0,1,0.5]) colors = {'r', 'g', 'b', 'y';'c', 'm', 'g','c'};L = 0.8;center = [0,9.5]; % 定义风车的圆心T=[0 pi/3];for j = 1:4 for i=1:2 theta1 = (j-1) * pi/2+T(i); theta2 = theta1 + pi/2; P0 = center; P1 = center + L * [cos(theta1), sin(theta1)]; P2 = center + L * [cos(theta2), sin(theta2)]; Psharp = (P1 + P2) / 2; fill([P0(1), P1(1), Psharp(1)], [P0(2), P1(2), Psharp(2)], colors{i,j},'EdgeColor','none','FaceAlpha',0.8); endend%手pause(0.3)ellipse = EllipsePlotter('a',3, 'b',0.8, 'x',8.5, 'y',6, ... 'plotType', 'fill', 'fillColor',[.4 .4 .4], 'rotation', -30, ... 'angleRange',[100,250],'alpha',1,'lineWidth',2,'lineColor',[1,1,1]*0.6);ellipse.plotEllipse();ellipse = EllipsePlotter('a',3, 'b',0.8, 'x',8.7, 'y',6.1, ... 'plotType', 'fill', 'fillColor',[.4 .4 .4], 'rotation', -30, ... 'angleRange',[100,250],'alpha',1,'lineWidth',2,'lineColor','none');ellipse.plotEllipse();pause(0.3)ellipse = EllipsePlotter('a',3, 'b',0.8, 'x',2.6, 'y',6, ... 'plotType', 'fill', 'fillColor',[.4 .4 .4], 'rotation',20, ... 'angleRange',[100,270],'alpha',1,'lineWidth',2,'lineColor',[1,1,1]*0.6);ellipse.plotEllipse();ellipse = EllipsePlotter('a',3, 'b',0.8, 'x',2.7, 'y',5.95, ... 'plotType', 'fill', 'fillColor',[.4 .4 .4], 'rotation',20, ... 'angleRange',[100,270],'alpha',1,'lineWidth',2,'lineColor','none');ellipse.plotEllipse();pause(0.3)tex=sprintf('不给糖果( s# t7 u" I/ P! S% k
就捣蛋');text(8,13,tex,'FontSize',30,'FontWeight','bold','Color','w');( f0 }% C/ y! }8 O
flpvu05dinc64027194243.png
 % c5 ~6 I/ P% j! |" |
其中绘制风车代码:hold onplot([0 0.2],[9.5 7],'LineWidth',3,'Color',[0,0,1,0.5]) colors = {'r', 'g', 'b', 'y';'c', 'm', 'g','c'};L = 0.8;center = [0,9.5]; % 定义风车的圆心T=[0 pi/3];for j = 1:4 for i=1:2 theta1 = (j-1) * pi/2+T(i); theta2 = theta1 + pi/2; P0 = center; P1 = center + L * [cos(theta1), sin(theta1)]; P2 = center + L * [cos(theta2), sin(theta2)]; Psharp = (P1 + P2) / 2; fill([P0(1), P1(1), Psharp(1)], [P0(2), P1(2), Psharp(2)], colors{i,j},'EdgeColor','none','FaceAlpha',0.8); endend
) C% X ~( l1 ^% j- V
moi4vplp24o64027194343.png
 8 ~& e8 ]3 D* w% ` w
其中爱心代码:
5 V, }' r1 X- M# Yt=0:0.025:2*pi;x=(16*sin(t).^3)/10+5.5;y=(13*cos(t)-5*cos(2*t)-2*cos(3*t)-cos(4*t))/10+4.8;fill(x,y,'r','edgecolor','r');
+ V" \& w4 T& E6 ]/ D
jniltsfe3wc64027194443.png

% n4 H! S8 R' u/ E其中 EllipsePlotter类函数代码如下3 D1 t% V& a2 j7 |# J3 ~
classdef EllipsePlotter properties a = 1; b = 1; x = 0; y = 0; angleRange = [0 2*pi]; rotation = 0; lineColor = 'b'; lineWidth = 1; plotType = 'plot'; fillColor = 'r'; alpha = 1; end methods function obj = EllipsePlotter(varargin) % Constructor if nargin > 0 for i = 1:2:nargin obj.(varargin{i}) = varargin{i+1}; end end startRadian = obj.angleRange(1) * pi / 180; endRadian = obj.angleRange(2) * pi / 180; theta = startRadian:pi/100:endRadian; end function plotEllipse(obj) startRadian = obj.angleRange(1) * pi / 180; endRadian = obj.angleRange(2) * pi / 180; theta = startRadian:pi/100:endRadian; X = obj.a * cos(theta); Y = obj.b * sin(theta); % 旋转坐标 rotationMatrix = [cosd(obj.rotation), -sind(obj.rotation); sind(obj.rotation), cosd(obj.rotation)]; xyRotated = [X; Y]' * rotationMatrix; % 将旋转后的椭圆平移到指定的位置 XY(:,1) = xyRotated(:,1) + obj.x; XY(:,2) = xyRotated(:,2) + obj.y; % 根据 plotType 来绘制椭圆 if strcmp(obj.plotType, 'plot') plot(XY(:,1), XY(:,2), '-', 'Color', obj.lineColor, 'LineWidth', obj.lineWidth); hold on; axis equal elseif strcmp(obj.plotType, 'fill') fill(XY(:,1), XY(:,2), obj.fillColor, 'EdgeColor', obj.lineColor, 'FaceAlpha', obj.alpha, 'LineWidth', obj.lineWidth); hold on; axis equal else error('无效的 plotType 参数!'); end end endend
9 | J, @. m3 e& g# f3 B属性 (properties)这些属性定义了椭圆的参数和绘图样式。
+ @4 X y4 x: @ h! [' za, b: 椭圆的主轴和次轴的长度。
; H6 {3 ?+ {4 m6 [: _. o7 Px, y: 椭圆的中心位置。% Q5 e/ e7 q$ ?' x% Y9 r
angleRange: 绘制椭圆的角度范围。 [ {4 l$ q/ C& J/ l: Z# V! H
rotation: 椭圆的旋转角度。
% F8 S6 ^. R! d2 @$ ?lineColor: 椭圆边界的颜色。
' k9 W7 w# [: a- y% S8 f) r2 ]lineWidth: 椭圆边界的线宽。# c+ u; }: U, C; c% v* f
plotType: 绘图类型,可以是 'plot' 或 'fill'。! ?" Z& F$ w# f ~2 W1 c0 V
fillColor: 如果 plotType 是 'fill',则此属性定义填充颜色。
2 _0 Y: N- B2 T* Q( galpha: 填充的透明度。6 Q7 S {" F6 t2 N! [% X* i
方法 (methods)这些方法定义了类的功能。5 K6 A5 z+ Y& c) e
构造函数 (EllipsePlotter):1 k& S3 {: w0 ~, s1 }' w) `) w
当创建这个类的对象时,它会被调用。2 F& K/ k* @4 O7 u
它接受一系列的名称-值对参数,允许在创建对象时设置属性。$ T* M0 v8 q( A; T2 k; ~
它目前只计算了一个角度范围,但并没有使用这个范围做任何其他事情。) Y% J( Q* ^; Y5 W
plotEllipse:
4 |3 I* v, U" {该方法根据对象的属性值绘制一个椭圆。
& c* H L! y. p$ b1 J; {) E& w它首先计算了椭圆上的点的坐标。
# U% y$ G' J% _4 E2 ]6 [; v然后根据 rotation 属性旋转这些点。
% D; w4 z% e( r接着将旋转后的点平移到 x 和 y 属性指定的位置。
+ V! ~- X( }, T/ z( \" q最后,根据 plotType 属性选择绘制方式:'plot' 会绘制椭圆的轮廓,而 'fill' 会填充椭圆。
8 l3 s/ v4 e# }& z* k1 Z[/ol]这个类可以使用户轻松地创建和定制椭圆的绘图,而不必每次都重复相同的计算和绘图代码。例如,用户可以轻松地更改椭圆的大小、位置、颜色和旋转,并立即看到结果。- -THE END- -
" r. _* V2 n( T# C9 c4 p源码下载:gitee下载:https://gitee.com/iDMatlab/ghost* G7 w" y* l, C/ M* E0 |/ J# G
wqxgg24x4e364027194543.png

' f, Z2 M1 d) O! g3 z- D- y0 [QQ群下载:
8 l4 i' g* ~, Y8 ?/ {
c4evkizy1o064027194643.jpg
 8 D. F$ E! R0 _9 x1 P
参考资料:( l2 I; d5 W) i. W2 I! h! S
【1】【好玩的源码】MATLAB画冰墩墩【2】【好玩的源码】儿童节快乐!送你一只可爱的小猪佩琪1 J! J- o! X0 `! I" D/ v. Q
6 Q3 ~6 f+ q! w4 t; G
hgjzbd1yglj64027194743.gif
 / {/ g4 x& `# t$ F7 h+ n
wshgiqahstx64027194843.png

: A7 d1 K7 M* O7 C/ E3 v N( f3 J K送书活动% p- @1 t3 J. u9 { r2 e: \
y1id405bpma64027194943.png
 + R4 F+ C) f) O/ J- H
1fxlbjaprkv64027195043.gif

' y% \2 M* V( I# C) Z
! Z+ g- F* D2 h4 ?$ p2 g包邮赠送 「北京大学出版社」赞助《AI时代Excel数据分析提升之道》AI时代Excel数据分析提升之道:知识精进+学习答疑+上机实训+综合实战+ChatGPT应用,零基础入门,极速提升数据分析效率!零基础入门宝典,由浅入深讲解,无须额外的背景知识即可学习掌握。内容系统全面,可帮助读者快速了解使用Python进行Excel数据分析的基本语法并掌握开发能力。理论与实践相结合,每个理论都有对应的代码示例,读者参考代码示例完成编写,就可以看到实践效果。本书配有实训与问答,方便读者阅读后尽快巩固知识点,做到举一反三、学以致用。AI前沿产品ChatGPT+Python进行Excel数据分析,大幅学习和分析的效率
u- F" v5 o4 K# H, u5 C0 L了解更多7 x3 H; ?2 R: a$ i e# K
【抽奖方式及满足条件】:
4 Q4 o* H7 I7 Y( i& w1.关注「好玩的MATLAB 」公众号和视频号 X% I% f. A2 ?0 M
co1o2v4eapq64027195143.jpg
 # d0 C4 H+ s5 d# e
2.给本文点【赞】+【在看】;
R% R6 P& V7 T3.留言区评论点赞最多的前3名。/ x( R& x& U# L3 f
4.本活动只针对从未获过奖的同学,之前获过奖的小伙伴,不用参加。6 G5 c) ^0 {' N R" p: U2 Y; K( d
同时满足上述4个条件的读者朋友,包邮赠送一本。
, Y- n' s: c/ A7 T【开奖时间】:2023年11月2日中午12点
/ y5 _- v4 x2 M; Q7 O- H$ u【领奖方式】:在开奖时加小编私人微信:idmatlab
+ y- ~: }) |2 ?; k. [7 {( e) A扫一扫加管理员微信5 c4 M' ^- o3 E$ o! Y* _
vj1awbxhcmf64027195243.png
 " y7 w; P1 w* z& w4 U, |6 S3 V
rxfnjydvfgd64027195343.jpg

|